Milestone 6 - Project Results
Expected Results
This is an example for the expected results:
Annual Temperature Animation
Annual Temperature calculated with the 2D-EBM model:
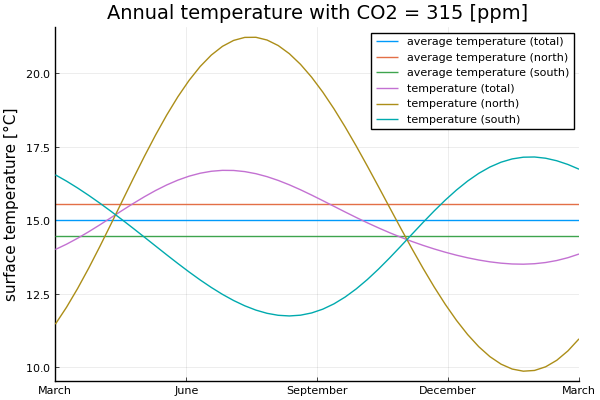
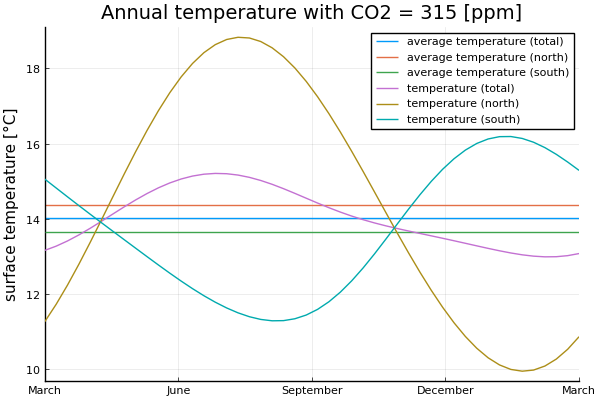
Mean Temperature Plot using the 2D-EBM
Plot of the mean and average temperature calculated by using the 2D-EBM and then averaging over the results:
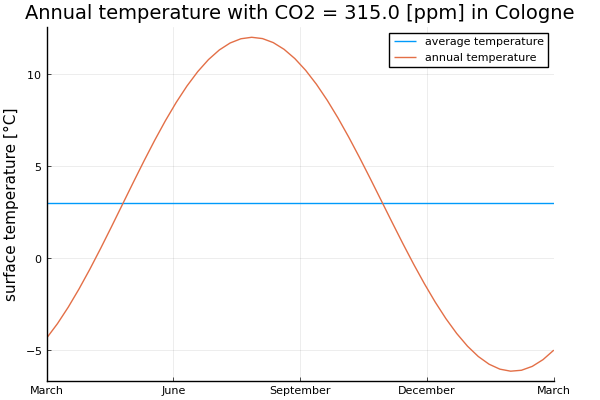
Cologne Temperature using the 2D-EBM
Cologne temperature calculated using the 2D-EBM model:
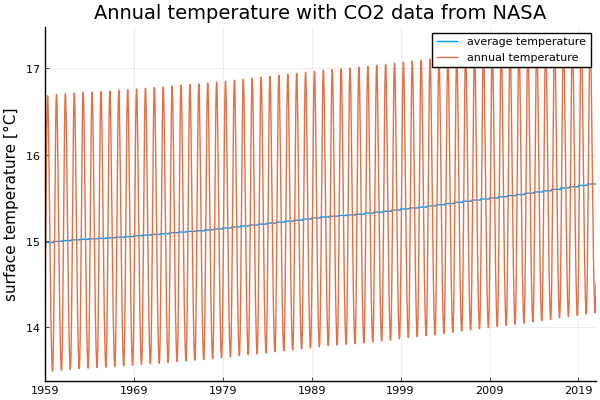
Temperature for the NASA CO2 Data
Annual Temperatures from 1959 to 2020 based on NASA CO2 data:
Mean Temperature Plot for Ziegler's data
Plot of the mean and average temperature calculated by using the 2D-EBM with Ziegler's parameters and then averaging over the results:
⚠ Warning!
We strongly suggest to first work on the solutions on your own/within your group without checking directly for the reference solutions.
Files Download
The Python implementation of milestone 6 can be downloaded here (Julia version will be added soon):
Scripts for Milestone 6
You can also check out our Julia and Python implementations of milestone 6 in this site.
Julia implementation of milestone 6
include("milestone1.jl")
include("milestone2.jl")
include("milestone3.jl")
include("milestone4.jl")
include("milestone5.jl")

using SparseArrays

function timestep_euler_backward_2d(jacobian, delta_t)
    A = factorize(sparse(I - delta_t * jacobian))

    function timestep_function(temperature, t, delta_t,
                               mesh, diffusion_coeff, heat_capacity, solar_forcing,
                               radiative_cooling)
        if t == 1
            t_old = size(temperature, 3)
        else
            t_old = t - 1
        end
        # Similar to MS3, we have to solve the equation
        # T_t = T_{t-1} + delta_t * f(T_t, t),
        # where f(T, t) = R(T) + F(t).
        # We use the fact that R is linear and thus can be written as R(T) = AT, where A is the Jacobian of R.
        # Solving for T_t yields
        # T_t = (I - delta_t * A)^{-1} * (T_{t-1} + delta_t * F(t)).
        @views source_terms = calc_source_terms_ebm_2d(heat_capacity,
                                                       solar_forcing[:, :, t],
                                                       radiative_cooling)

        return @views temperature[:, :, t] = reshape(A \ vec(temperature[:, :, t_old] +
                                                         delta_t * source_terms),
                                                     (mesh.n_latitude, mesh.n_longitude))
    end

    return timestep_function
end

function co2_evolution(jacobian, mesh, diffusion_coeff, heat_capacity, solar_forcing)
    # Read CO2 data
    co2_data = readdlm(joinpath(@__DIR__, "input", "co2_nasa.dat"))

    # Assume that only data for full years is available
    n_years = Int(size(co2_data, 1) / 12)

    average_co2 = [sum(co2_data[(12y + 1):(12y + 12), 4]) / 12 for y in 0:(n_years - 1)]

    ntimesteps = size(solar_forcing, 3)

    average_temperatures = zeros(n_years)
    annual_temperatures = zeros(ntimesteps * n_years)

    timestep_function = timestep_euler_backward_2d(jacobian, 1 / ntimesteps)

    temperature_grid = 15 *
                       ones((mesh.n_latitude, mesh.n_longitude, size(solar_forcing, 3)))

    for y in 1:n_years
        radiative_cooling = calc_radiative_cooling_co2(average_co2[y])
        (temperature_grid,
         area_mean_temp) = compute_equilibrium_2d(timestep_function,
                                                  mesh, diffusion_coeff,
                                                  heat_capacity,
                                                  solar_forcing,
                                                  radiative_cooling,
                                                  rel_error=1.0e-2,
                                                  initial_temperature=temperature_grid)
        annual_temperatures[(ntimesteps * (y - 1) + 1):(ntimesteps * y)] = area_mean_temp
        average_temperatures[y] = sum(area_mean_temp) / ntimesteps
    end

    first_year = Int(co2_data[1, 1])
    last_year = Int(co2_data[end, 1])

    return annual_temperatures, average_temperatures, first_year, last_year
end

function plot_co2_evolution(jacobian, mesh, diffusion_coeff, heat_capacity, solar_forcing)
    (annual_temperatures, average_temperatures, first_year,
     last_year) = co2_evolution(jacobian, mesh, diffusion_coeff,
                                heat_capacity, solar_forcing)

    n_timesteps = length(annual_temperatures)

    average_temperatures_per_month = [average_temperatures[floor(Int,
                                                                                      (t - 1) / 48) + 1]
                                      for t in 1:n_timesteps]

    labels = first_year:10:last_year

    p = plot(average_temperatures_per_month, label="average temperature",
             xlims=(1, n_timesteps), xticks=(1:480:n_timesteps, labels),
             ylabel="surface temperature [°C]",
             title="Annual temperature with CO2 data from NASA")
    plot!(p, annual_temperatures, label="annual temperature")

    return p
end

function calc_albedo_ziegler(geo_dat)
    function legendre(latitude)
        return 0.5 * (3 * sin(latitude)^2 - 1)
    end

    function albedo(surface_type, latitude)
        if surface_type == 1
            return 0.32 + 0.05 * legendre(latitude)
        elseif surface_type == 2
            return 0.6
        elseif surface_type == 3
            return 0.7
        elseif surface_type == 5
            return 0.289 + 0.08 * legendre(latitude)
        else
            error("Unknown surface type $surface_type.")
        end
    end

    nlatitude, nlongitude = size(geo_dat)
    y_lat = range(pi / 2, -pi / 2, length=nlatitude)

    # Map surface type to albedo.
    return [albedo(geo_dat[i, j], y_lat[i]) for i in 1:nlatitude, j in 1:nlongitude]
end

function calc_heat_capacity_ziegler(geo_dat)
    sec_per_yr = 3.15576e7  # seconds per year

    c_atmos = 0.79e6
    c_ocean = 394.47e6
    c_seaice = 4.83e6
    c_land = 1.87e6
    c_snow = 1.52e6

    function heat_capacity(surface_type)
        if surface_type == 1
            capacity_surface = c_land
        elseif surface_type == 2
            capacity_surface = c_seaice
        elseif surface_type == 3
            capacity_surface = c_snow
        elseif surface_type == 5
            capacity_surface = c_ocean
        else
            error("Unknown surface type $surface_type.")
        end

        return (capacity_surface + c_atmos) / sec_per_yr
    end

    nlatitude, nlongitude = size(geo_dat)
    return [heat_capacity(geo_dat[i, j]) for i in 1:nlatitude, j in 1:nlongitude]
end

function calc_diffusion_coefficients_ziegler(geo_dat)
    nlatitude, nlongitude = size(geo_dat)

    coeff_ocean_poles = 0.4
    coeff_ocean_equator = 0.9
    coeff_equator = 0.9
    coeff_north_pole = 0.45
    coeff_south_pole = 0.12

    function diffusion_coefficient(i, j)
        # Compute the i value of the equator
        i_equator = div(nlatitude, 2) + 1

        theta = pi * (i - 1) / (nlatitude - 1)
        colat = sin(theta)^5

        geo = geo_dat[i, j]
        if geo == 5  # ocean
            return coeff_ocean_poles + (coeff_ocean_equator - coeff_ocean_poles) * colat
        else  # land, sea ice, etc
            if i <= i_equator  # northern hemisphere
                # on the equator colat=1 -> coefficients for norhern/southern hemisphere cancels out
                return coeff_north_pole + (coeff_equator - coeff_north_pole) * colat
            else  # southern hemisphere
                return coeff_south_pole + (coeff_equator - coeff_south_pole) * colat
            end
        end
    end

    return [diffusion_coefficient(i, j) for i in 1:nlatitude, j in 1:nlongitude]
end

function simulation_ziegler(geo_dat, mesh, true_longitude)
    albedo = calc_albedo_ziegler(geo_dat)
    heat_capacity = calc_heat_capacity_ziegler(geo_dat)

    solar_forcing = calc_solar_forcing(albedo, true_longitude)
    ntimesteps = length(true_longitude)
    diffusion_coeff = calc_diffusion_coefficients_ziegler(geo_dat)

    co2_ppm = 315.0
    radiative_cooling = calc_radiative_cooling_co2(co2_ppm, 315.0, 210.2)

    jacobian = calc_jacobian_ebm_2d(mesh, diffusion_coeff, heat_capacity, 2.13)

    (temperature,
     area_mean_temp) = compute_equilibrium_2d(timestep_euler_backward_2d(jacobian,
                                                                         1 / ntimesteps),
                                              mesh, diffusion_coeff, heat_capacity,
                                              solar_forcing,
                                              radiative_cooling)

    # Copied from MS4
    # Area mean of pointwise annual temperature
    annual_mean_temperature_north = [calc_mean_north(temperature[:, :, t], mesh.area)
                                     for t in 1:ntimesteps]
    annual_mean_temperature_south = [calc_mean_south(temperature[:, :, t], mesh.area)
                                     for t in 1:ntimesteps]
    annual_mean_temperature_total = [calc_mean(temperature[:, :, t], mesh.area)
                                     for t in 1:ntimesteps]

    average_temperature_north = sum(annual_mean_temperature_north) / ntimesteps
    average_temperature_south = sum(annual_mean_temperature_south) / ntimesteps
    average_temperature_total = sum(annual_mean_temperature_total) / ntimesteps

    p = plot_annual_temperature_north_south(annual_mean_temperature_north,
                                            annual_mean_temperature_south,
                                            annual_mean_temperature_total,
                                            average_temperature_north,
                                            average_temperature_south,
                                            average_temperature_total)

    return p
end

# Run code
function milestone6()
    geo_dat = read_geography(joinpath(@__DIR__, "input", "The_World128x65.dat"))
    mesh = Mesh(geo_dat)

    albedo = calc_albedo(geo_dat)
    heat_capacity = calc_heat_capacity(geo_dat)

    # Compute solar forcing
    true_longitude = read_true_longitude(joinpath(@__DIR__, "input", "True_Longitude.dat"))
    solar_forcing = calc_solar_forcing(albedo, true_longitude)
    ntimesteps = length(true_longitude)

    # Compute and plot diffusion coefficient
    diffusion_coeff = calc_diffusion_coefficients(geo_dat)

    co2_ppm = 315.0
    radiative_cooling = calc_radiative_cooling_co2(co2_ppm)

    jacobian = calc_jacobian_ebm_2d(mesh, diffusion_coeff, heat_capacity)

    (temperature,
     _) = compute_equilibrium_2d(timestep_euler_backward_2d(jacobian,
                                                            1 / ntimesteps),
                                 mesh, diffusion_coeff, heat_capacity,
                                 solar_forcing,
                                 radiative_cooling)

    plot_mean_temperature = plot_temperature(temperature, geo_dat, 1)

    # Copied from MS4
    # Area mean of pointwise annual temperature
    annual_mean_temperature_north = [calc_mean_north(temperature[:, :, t], mesh.area)
                                     for t in 1:ntimesteps]
    annual_mean_temperature_south = [calc_mean_south(temperature[:, :, t], mesh.area)
                                     for t in 1:ntimesteps]
    annual_mean_temperature_total = [calc_mean(temperature[:, :, t], mesh.area)
                                     for t in 1:ntimesteps]

    average_temperature_north = sum(annual_mean_temperature_north) / ntimesteps
    average_temperature_south = sum(annual_mean_temperature_south) / ntimesteps
    average_temperature_total = sum(annual_mean_temperature_total) / ntimesteps

    plot_temperature_ = plot_annual_temperature_north_south(annual_mean_temperature_north,
                                                            annual_mean_temperature_south,
                                                            annual_mean_temperature_total,
                                                            average_temperature_north,
                                                            average_temperature_south,
                                                            average_temperature_total)

    # Compute temperature in Cologne.
    # Cologne lies about halfway between these two grid points.
    annual_temperature_cologne = (temperature[15, 68, :] +
                                  temperature[15, 69, :]) / 2
    average_temperature_cologne = sum(annual_temperature_cologne) / ntimesteps

    plot_cologne = plot_annual_temperature(annual_temperature_cologne,
                                           average_temperature_cologne,
                                           "Annual temperature with CO2 = $co2_ppm [ppm] in Cologne")

    plot_temperature_co2 = plot_co2_evolution(jacobian, mesh, diffusion_coeff,
                                              heat_capacity, solar_forcing)

    plot_ziegler = simulation_ziegler(geo_dat, mesh, true_longitude)

    # Animate annual temperature
    anim = @animate for ts in 1:ntimesteps
        plot_temperature(temperature, geo_dat, ts)
    end

    plot_temperature_day_80 = plot_temperature(temperature, geo_dat, 1)
    gif_temperature = gif(anim, joinpath(@__DIR__, "annual_temperature.gif"), fps=7)

    # Show the plots
    display(plot_mean_temperature)
    display(plot_temperature_)
    display(plot_cologne)
    display(plot_temperature_co2)
    display(plot_ziegler)
    display(gif_temperature)

    return plot_mean_temperature, plot_temperature_, plot_cologne,
           plot_temperature_co2, plot_ziegler, plot_temperature_day_80, gif_temperature
end
Python implementation of milestone 6
import os

import imageio
import numpy as np
from matplotlib import pyplot as plt
from scipy import sparse

from milestone1 import read_geography
from milestone2 import calc_albedo, calc_heat_capacity, calc_solar_forcing, read_true_longitude
from milestone3 import calc_radiative_cooling_co2, calc_mean, plot_annual_temperature
from milestone4 import plot_annual_temperature_north_south, calc_mean_north, calc_mean_south, plot_temperature
from milestone5 import calc_diffusion_coefficients, calc_source_terms_ebm_2d, Mesh, compute_equilibrium_2d, \
    calc_jacobian_ebm_2d


def timestep_euler_backward_2d(jacobian, delta_t_):
    m, n = jacobian.shape
    eye = sparse.eye(m, n, format="csc")
    jacobian = sparse.csc_matrix(jacobian)
    solve = sparse.linalg.factorized(eye - delta_t_ * jacobian)

    def timestep_function(temperature, t, delta_t,
                          mesh, _, heat_capacity, solar_forcing, radiative_cooling):
        # Similar to MS3, we have to solve the equation
        # T_t = T_{t-1} + delta_t * f(T_t, t),
        # where f(T, t) = R(T) + F(t).
        # We use the fact that R is linear and thus can be written as R(T) = AT, where A is the Jacobian of R.
        # Solving for T_t yields
        # T_t = (I - delta_t * A)^{-1} * (T_{t-1} + delta_t * F(t)).
        source_terms = calc_source_terms_ebm_2d(heat_capacity, solar_forcing[:, :, t], radiative_cooling)

        temperature[:, :, t] = np.reshape(solve((temperature[:, :, t - 1] + delta_t * source_terms).flatten()),
                                          (mesh.n_latitude, mesh.n_longitude))

    return timestep_function


def co2_evolution(jacobian, mesh, diffusion_coeff, heat_capacity, solar_forcing):
    # Read CO2 data
    co2_data = np.genfromtxt("input/co2_nasa.dat")

    # Assume that only data for full years is available
    n_years = int(co2_data.shape[0] / 12)

    average_co2 = np.array(
        [np.sum(co2_data[12 * y:12 * (y + 1), 3]) / 12 for y in range(n_years)]
    )

    ntimesteps = solar_forcing.shape[2]

    average_temperatures = np.zeros(n_years)
    annual_temperatures = np.zeros(ntimesteps * n_years)

    timestep_function = timestep_euler_backward_2d(jacobian, 1 / ntimesteps)

    temperature = np.zeros((mesh.n_latitude, mesh.n_longitude, solar_forcing.shape[2]))

    for y in range(n_years):
        radiative_cooling = calc_radiative_cooling_co2(average_co2[y])
        temperature, area_mean_temp = compute_equilibrium_2d(timestep_function,
                                                   mesh, diffusion_coeff, heat_capacity, solar_forcing,
                                                   radiative_cooling,
                                                   initial_temperature=temperature, rel_error=1e-2)
        annual_temperatures[ntimesteps * y:ntimesteps * (y + 1)] = area_mean_temp
        average_temperatures[y] = np.sum(area_mean_temp) / ntimesteps

    first_year = int(co2_data[0, 0])
    last_year = int(co2_data[-1, 0])

    return annual_temperatures, average_temperatures, first_year, last_year


def plot_co2_evolution(jacobian, mesh, diffusion_coeff, heat_capacity, solar_forcing):
    fig, ax = plt.subplots()

    annual_temperatures, average_temperatures, first_year, last_year = co2_evolution(jacobian, mesh, diffusion_coeff,
                                                                                     heat_capacity, solar_forcing)
    n_timesteps = len(annual_temperatures)

    average_temperatures_per_month = np.array(
        [average_temperatures[int(t / 48)] for t in range(n_timesteps)]
    )

    plt.plot(average_temperatures_per_month, label="average temperature")
    plt.plot(annual_temperatures, label="annual temperature")

    plt.xlim((0, n_timesteps - 1))
    labels = np.arange(first_year, last_year, 10)
    plt.xticks(np.arange(0, n_timesteps - 1, 480), labels)
    ax.set_ylabel("surface temperature [°C]")
    plt.grid()
    plt.title("Annual temperature with CO2 data from NASA")
    plt.legend(loc="upper right")

    plt.tight_layout()
    plt.show()


def calc_albedo_ziegler(geo_dat):
    def legendre(latitude):
        return 0.5 * (3 * np.sin(latitude) ** 2 - 1)

    def albedo(surface_type, latitude):
        if surface_type == 1:
            return 0.32 + 0.05 * legendre(latitude)
        elif surface_type == 2:
            return 0.6
        elif surface_type == 3:
            return 0.7
        elif surface_type == 5:
            return 0.289 + 0.08 * legendre(latitude)
        else:
            raise ValueError(f"Unknown surface type {surface_type}.")

    nlatitude, nlongitude = geo_dat.shape
    y_lat = np.linspace(np.pi / 2, -np.pi / 2, nlatitude)

    # Map surface type to albedo.
    return np.array([[albedo(geo_dat[i, j], y_lat[i])
                      for j in range(nlongitude)]
                     for i in range(nlatitude)])


def calc_heat_capacity_ziegler(geo_dat):
    sec_per_yr = 3.15576e7  # seconds per year

    c_atmos = 0.79e6
    c_ocean = 394.47e6
    c_seaice = 4.83e6
    c_land = 1.87e6
    c_snow = 1.52e6

    def heat_capacity(surface_type):
        if surface_type == 1:
            capacity_surface = c_land
        elif surface_type == 2:
            capacity_surface = c_seaice
        elif surface_type == 3:
            capacity_surface = c_snow
        elif surface_type == 5:
            capacity_surface = c_ocean
        else:
            raise ValueError(f"Unknown surface type {surface_type}.")

        return (capacity_surface + c_atmos) / sec_per_yr

    # Map surface type to heat capacity.
    nlatitude, nlongitude = geo_dat.shape
    return np.array([[heat_capacity(geo_dat[i, j])
                      for j in range(nlongitude)]
                     for i in range(nlatitude)])


def calc_diffusion_coefficients_ziegler(geo_dat):
    nlatitude, nlongitude = geo_dat.shape

    coeff_ocean_poles = 0.4
    coeff_ocean_equator = 0.9
    coeff_equator = 0.9
    coeff_north_pole = 0.45
    coeff_south_pole = 0.12

    def diffusion_coefficient(j, i):
        # Compute the j value of the equator
        j_equator = int(nlatitude / 2)

        theta = np.pi * j / np.real(nlatitude - 1)
        colat = np.sin(theta) ** 5

        geo = geo_dat[j, i]
        if geo == 5:  # ocean
            return coeff_ocean_poles + (coeff_ocean_equator - coeff_ocean_poles) * colat
        else:  # land, sea ice, etc
            if j <= j_equator:  # northern hemisphere
                # on the equator colat=1 -> coefficients for norhern/southern hemisphere cancels out
                return coeff_north_pole + (coeff_equator - coeff_north_pole) * colat
            else:  # southern hemisphere
                return coeff_south_pole + (coeff_equator - coeff_south_pole) * colat

    return np.array(
        [[diffusion_coefficient(j, i) for i in range(nlongitude)] for j in range(nlatitude)]
    )


def simulation_ziegler(geo_dat, mesh, true_longitude):
    albedo = calc_albedo_ziegler(geo_dat)
    heat_capacity = calc_heat_capacity_ziegler(geo_dat)

    solar_forcing = calc_solar_forcing(albedo, true_longitude)
    ntimesteps = len(true_longitude)
    diffusion_coeff = calc_diffusion_coefficients_ziegler(geo_dat)

    co2_ppm = 315.0
    radiative_cooling = calc_radiative_cooling_co2(co2_ppm, radiative_cooling_base=210.2)

    jacobian = calc_jacobian_ebm_2d(mesh, diffusion_coeff, heat_capacity, radiative_cooling_feedback=2.13)

    temperature, area_mean_temp = compute_equilibrium_2d(timestep_euler_backward_2d(jacobian, 1 / ntimesteps),
                                                         mesh, diffusion_coeff, heat_capacity, solar_forcing,
                                                         radiative_cooling)

    # Copied from MS4
    # Area mean of pointwise annual temperature
    annual_mean_temperature_north = [calc_mean_north(temperature[:, :, t], mesh_.area) for t in range(ntimesteps)]
    annual_mean_temperature_south = [calc_mean_south(temperature[:, :, t], mesh_.area) for t in range(ntimesteps)]
    annual_mean_temperature_total = [calc_mean(temperature[:, :, t], mesh_.area) for t in range(ntimesteps)]

    average_temperature_north = np.sum(annual_mean_temperature_north) / ntimesteps
    average_temperature_south = np.sum(annual_mean_temperature_south) / ntimesteps
    average_temperature_total = np.sum(annual_mean_temperature_total) / ntimesteps

    plot_annual_temperature_north_south(annual_mean_temperature_north, annual_mean_temperature_south,
                                        annual_mean_temperature_total, average_temperature_north,
                                        average_temperature_south, average_temperature_total)


# Run code
if __name__ == '__main__':
    geo_dat_ = read_geography("input/The_World128x65.dat")
    mesh_ = Mesh(geo_dat_)

    albedo_ = calc_albedo(geo_dat_)
    heat_capacity_ = calc_heat_capacity(geo_dat_)

    # Compute solar forcing
    true_longitude_ = read_true_longitude("input/True_Longitude.dat")
    solar_forcing_ = calc_solar_forcing(albedo_, true_longitude_)
    ntimesteps_ = len(true_longitude_)

    diffusion_coeff_ = calc_diffusion_coefficients(geo_dat_)

    co2_ppm_ = 315.0
    radiative_cooling_ = calc_radiative_cooling_co2(co2_ppm_)

    jacobian_ = calc_jacobian_ebm_2d(mesh_, diffusion_coeff_, heat_capacity_)

    temperature_, area_mean_temp_ = compute_equilibrium_2d(timestep_euler_backward_2d(jacobian_, 1 / ntimesteps_),
                                                           mesh_, diffusion_coeff_, heat_capacity_, solar_forcing_,
                                                           radiative_cooling_)

    # Copied from MS4
    # Area mean of pointwise annual temperature
    annual_mean_temperature_north_ = [calc_mean_north(temperature_[:, :, t], mesh_.area) for t in range(ntimesteps_)]
    annual_mean_temperature_south_ = [calc_mean_south(temperature_[:, :, t], mesh_.area) for t in range(ntimesteps_)]
    annual_mean_temperature_total_ = [calc_mean(temperature_[:, :, t], mesh_.area) for t in range(ntimesteps_)]

    average_temperature_north_ = np.sum(annual_mean_temperature_north_) / ntimesteps_
    average_temperature_south_ = np.sum(annual_mean_temperature_south_) / ntimesteps_
    average_temperature_total_ = np.sum(annual_mean_temperature_total_) / ntimesteps_

    plot_annual_temperature_north_south(annual_mean_temperature_north_, annual_mean_temperature_south_,
                                        annual_mean_temperature_total_, average_temperature_north_,
                                        average_temperature_south_, average_temperature_total_)

    # Compute temperature in Cologne.
    # Cologne lies about halfway between these two grid points.
    annual_temperature_cologne = (temperature_[14, 67, :] +
                                  temperature_[14, 68, :]) / 2
    average_temperature_cologne = np.sum(annual_temperature_cologne) / ntimesteps_

    plot_annual_temperature(annual_temperature_cologne, average_temperature_cologne,
                            f"Annual temperature_ with CO2 = {co2_ppm_} [ppm] in Cologne")

    plot_co2_evolution(jacobian_, mesh_, diffusion_coeff_, heat_capacity_, solar_forcing_)

    simulation_ziegler(geo_dat_, mesh_, true_longitude_)

    # Plot temperature for each time step
    filenames = []
    for ts in range(48):
        filename_ = plot_temperature(temperature_, geo_dat_, ts, show_plot=False)
        filenames.append(filename_)

    # Build GIF
    frames = [imageio.v3.imread(filename_) for filename_ in filenames]
    imageio.mimsave("annual_temperature.gif", frames)

    # Remove files
    for filename_ in set(filenames):
        os.remove(filename_)
Created by Gregor Gassner and Andrés Rueda-Ramírez with contributions by Simone Chiocchetti, Daniel Bach, Sophia Horak, Philipp Baasch, Benjamin Bolm, Erik Faulhaber, and Luca Sommer. Last modified: April 02, 2026. Website built with Franklin.jl and the Julia programming language.